This article describes one way to model Adwords profitability in Excel. If you want to try out the spreadsheet, it’s attached below.
The most satisfying and powerful thing you can do with Excel is to model a real-world problem in a way that helps you make a better decision. For a model to be effective, it needs to expose inputs in a way that makes sense, and generate results that are easy to interpret.
In this article, we’ll use the seldom-seen Data Table to build a simple model that helps you visualize the profitability of a Google Adwords campaign.
Just like those word problems from your school days, the key is setting up the problem correctly.
A quick Adwords primer
Adwords is Google’s primary advertising service. For the purpose of this article, we’ll be discussing only Pay-per-click (PPC) advertising on Google’s search network.
When people search for things on Google, they use certain keywords. For example, they might search for “best todo list manager” or “japanese survival knife”. With Adwords, advertisers can bid on specific keywords. If the bid is high enough, the ads are displayed on the search result page, along with the search results. If a user clicks on an ad, the advertiser pays Google the amount of the bid. If a user doesn’t click on the ad, the advertiser pays nothing.
Making money with Adwords
In order to make money by advertising with Adwords, an advertiser must “convert” enough users into customers to pay for the clicks that don’t result in a sale, and still make a profit.
For example, if you, the advertiser, have a product that costs $100, and you bid on a keyword that costs $1.00 per click, you need to make a sale at least every 100 clicks just to break even:
100 clicks @ $1.00 = $100 = 1 sale
If you’re able to get more than one sale every 100 clicks, you’ll make money. If you get less than one sale per 100 clicks, you’ll lose money. If you have to pay $2.00 per click, you’ll need to make a sale at least every 50 clicks.
As you can see, if you’re going to use Adwords PPC to advertise, it’s important to understand the break-even point - that is, the conditions under which you’ll start to make money.
Note: To keep this article to the point, I am skipping a lot of potential complexity that could be part of Adwords. For example, you would normally bid on more than one keyword at the same time, the actual cost per click varies due to competition, etc.
Modeling the problem
Based on the information above, there are 3 key drivers of profit:
(1) the price of the product (2) the average cost per click (3) the percentage of clicks that can be converted to a sale
We can think of these as inputs (variables) for our problem. Intuitively, we know that a lower cost per click will allow us to buy more clicks per sale, and a higher conversion rate means we’ll need to buy fewer clicks to get each sale.
But what’s the best way to model the problem in Excel, so that we can see how the cost per click and conversion rate work together to determine profit? As usual, there is more than one way to skin the cat with Excel. However, the modest Data Table turns out to be a pretty good way to visualize the problem.
Setting things up
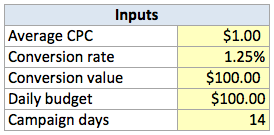
First things first, we need to provide an area on the worksheet meant for inputs. I like to group inputs together and label them in one area of the worksheet. For this problem, we’ll have:
- Average CPC - the average Cost Per Click
- Conversion rate - the percentage of clicks that can be converted into a sale
- Conversion value - the price of the product, less other costs (i.e. shipping)
- Daily budget - this determines how many clicks you can buy each day
- Campaign days - the number of days the campaign will run
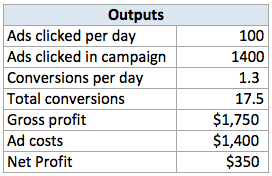
Now, we need to add an Outputs area. This is an area on the worksheet where will run the main calculations with fixed inputs. Specifically, we’ll figure out:
- Ads clicked per day = daily_budget / average_cpc
- Ads clicked in campaign = campaign_days * clicks_per_day
- Conversions per day = clicks_per_day * conversion_rate
- Total conversions = campaign_days * conversions_per_day
- Gross profit = total_conversions * value_per_conversion
- Ad costs = clicks_per_campaign * average_cpc
- Net Profit = gross_profit - total_ad_costs
With these formulas in place, we can actually figure out the break-even point manually, by fiddling around with the average cost per click and our estimated conversion rate.
But we don’t want to do that manually. We want Excel to do the hard work for us!
Enter the Data Table.
The Data Table
A Data Table is a dynamic table that shows the results of various input cells. Data Tables can handle either 1 or 2 inputs. In our case, a 2-input Data Table is a good fit, since we can cost per click as one input, and conversion rate as the other.
To create the data table:
- Add a reference to Net Profit to the upper left cell of the table
- Enter Average CPC estimates in the left column of the table
- Enter Conversion rate estimates in the top row of the table
- Select the entire table area
- Choose Data > Data Tools > What-If Analysis > Data Table
- In the Data table dialog box, select Conversion Rate for the Row Input
- In the Data table dialog box, select Average CPC for the Column Input
- Click OK.

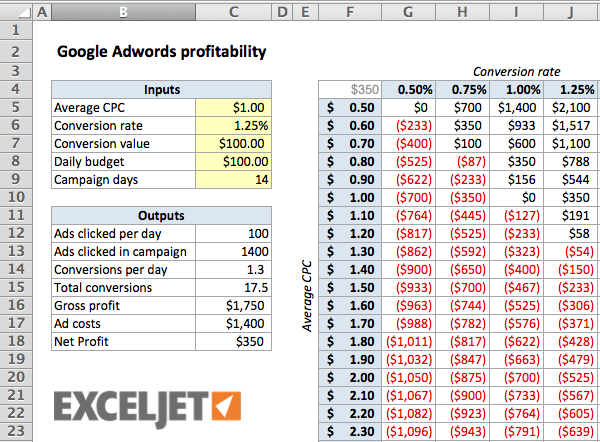
When you click OK, Excel will fill the table with Net Profit values that correspond to each pair of Average CPC and Conversion rate values. By using a currency number format with negative values displayed in red, you can easily see at a glance which combinations are profitable. Better yet, you can continue to adjust any of the main inputs, and all values plotted in the table will be updated dynamically.
Conclusion
Data Tables take a bit of work to set up, and they are limited to 2 inputs only, but they are a nice way to model a problem in a simple visual format.
Credits: This model was inspired by an example in John Walkenbach’s excellent book, Excel 2010 Bible .
If you want to master Excel keyboard shortcuts on a Mac, you need to take a moment to understand how the Mac keyboard is arranged, and how it can be configured through system preferences. This is especially important with Excel, which uses several function keys for shortcuts.
Function Keys
Modern Mac computers using an Apple keyboard have icons printed on some of the keys on the top row of the keyboard. These keys (F1 - F12) are called function keys.

On a Mac, function keys can be used in two ways:
(1) to perform special actions that correspond to the icon printed on the key, such as dimming or brightening the screen, showing the Dashboard, increasing or decreasing speaker volume, and so on.
(2) as standard function keys. In this case, the action performed will vary depending on (a) the application you are currently using or (b) the keyboard shortcuts listed in the Keyboard & Mouse pane of System Preferences.
Default behavior
The default behavior of Mac function keys is to perform the action indicated by the icon printed on the key. For example, the function key F10 has a small picture of a speaker, and pressing this key mutes and unmutes the system volume.
If you want to instead use F1 - F12 as standard function keys, hold the Fn key while pressing the function key. For example, Fn-F10 will perform the action assigned to the F10 key instead of toggling mute on or off.
Changing default behavior
A setting in System Preferences, in the Keyboard pane, controls the default behavior for function keys.

The setting is a checkbox labeled “Use all F1, F2, etc. keys as standard function keys unchecked”. When unchecked, function keys will perform as described in #1 above.
If you check the checkbox, F1 - F12 will behave as standard function keys, and you will need to press Fn to perform the actions indicated by special icons.
In general, unless you are using Excel all day on a Mac, you will probably find it more convenient to leave the default behavior alone and learn to use the Fn key for certain shortcuts in Excel. This is because it’s nice to be able to access the Mac dashboard, brightness, and volume without having to press Fn at the same time.
Changing keyboard shortcuts
You can change the keyboard shortcuts that are assigned to function keys in the Keyboard Shortcuts pane. For example, you could unassign F9 from Mission Control so that F9 can be available in other applications.

Related Links
- How to use the function keys on your Mac (Apple)
