Explanation
In this example, the goal is to retrieve the last available close price for each symbol shown in column B. This can be done with the STOCKHISTORY function . The main purpose of STOCKHISTORY is to retrieve historical stock price information, and we need to make a few adjustments to prevent errors that might occur when a close price is not available on a given date. We also need to adjust arguments to return just a single value per symbol, instead of an array of values that spill onto the worksheet into multiple cells.
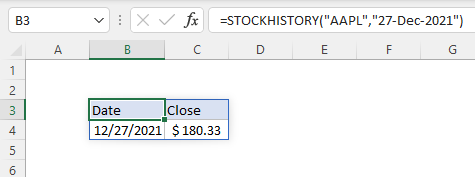
The STOCKHISTORY function retrieves historical stock price information based on a given symbol and date range. For example, to return the closing price for Apple, Inc. on December 27, 2021, you can use:
=STOCKHISTORY("AAPL","27-Dec-2021") // close price on Dec 27
The result is an array that includes headers, date, and close price:
To get a closing price for today , we can use the TODAY function instead of a fixed date.
=STOCKHISTORY("AAPL",TODAY()) // close price today
However, this formula is a bit fragile. If the current date (today) is a holiday or weekend, or if the market is open but not yet closed, STOCKHISTORY will return a #VALUE error. One way to handle this problem is to set the interval argument in STOCKHISTORY to monthly instead of daily:
=STOCKHISTORY("AAPL",TODAY(),,2) // close price this month
The last argument, 2, sets interval to monthly (2) instead of the default of daily (0). The result is the latest available close price in the current month. To adapt this example to work in the example, as shown above, we also need to get rid of the date and the header, since we only want the close price. We can do that by adjusting arguments like this:
=STOCKHISTORY(B5,TODAY(),,2,0,1)
Here, the zero after interval (2) sets the headers argument to “no headers”. The final 1 is a property setting that tells STOCKHISTORY to return the close price only. See the table here for more information about properties available to the STOCKHISTORY function.
When this formula is copied down the table, the result is the last available close price for each symbol in the current month. Note the formula will fail with a #VALUE error if there is not yet close price data in the current month. See below for a workaround.
Workarounds
The above formula works fine as long as there is at least one close price in the current month. However, if there is no price data yet in the current month, the formula will return a #VALUE error. As a workaround, we can modify the formula to retrieve the last week of close prices for a given symbol, then use the LOOKUP function to get the last value in the list:
=LOOKUP(TODAY()+1,STOCKHISTORY("MSFT",TODAY()-7,TODAY()))
This works because LOOKUP has some unique behaviors that make it useful for retrieving the last value in a list . Essentially, we are asking LOOKUP to find a value we know can’t exist (TODAY()+1). LOOKUP always operates in approximate match mode, assuming data is sorted. It scans to the end of the values looking for TODAY+1 and when that value isn’t found, it returns the last value in the second column. This is an example of the BigNum concept.
If you want to retrieve the date as well (as a reference for the price that comes back) you can use a more involved formula based on the LET function :
=LET(results,STOCKHISTORY("MSFT",TODAY()-7,TODAY()),INDEX(results,ROWS(results),0))
Rather than rely on approximate matching, this formula explicitly requests the last result. First, the LET function stores results from STOCKHISTORY in a variable called results . Next, the ROWS function counts the rows in results and feeds this number into the INDEX function as row_num. Finally, with results provided as array , and column_number hardcoded as 0, INDEX returns the last row in results . This row contains two values: the date and the close price on that date.
Explanation
In this example, the goal is to retrieve historical stock price information for a given stock, provided as a ticker symbol like “MSFT”, “AAPL”, “MMM”, etc. over the past n days, where n is a variable that can be changed as desired. In addition, the data should be sorted in reverse chronological order, with the latest information appearing first.
This can be done with the STOCKHISTORY function , whose main purpose is to retrieve historical information for a financial instrument over time.
Simple example
STOCKHISTORY retrieves historical stock price information based on a given symbol and date range. For example, to return the closing price for Apple, Inc. on December 27, 2021, you can use STOCKHISTORY like this:
=STOCKHISTORY("AAPL","27-Dec-2021") // close price on Dec 27
The result is an array that includes headers, date, and close price:
STOCKHISTORY takes a number of function arguments , but in this simple case, we only need to provide symbol and start_date . All other arguments are optional with default values: e nd_date defaults to start_date , interval defaults to daily, headers are on by default, and Date and Close are the default information retrieved. For a more detailed discussion, see our STOCKHISTORY function page .
STOCKHISTORY configuration
In the more complex example shown above, we need to supply additional information. We start by providing a reference to the symbol in I5:
=STOCKHISTORY(I5
Next, we add the start_date and end_date , which are calculated with the TODAY function :
=STOCKHISTORY(I5,TODAY()-I8,TODAY()
Notice that start_date is the current date minus I8, which is 30 in the example shown. This results in a date 30 days earlier than the date returned by TODAY. This works because Excel dates are just large serial numbers . The end_date is simply the value returned by TODAY – the current date.
The next two arguments are interval and headers , and we leave these at their defaults, by using empty commas:
STOCKHISTORY(I5,TODAY()-I8,TODAY(),,,
Finally, we need to specify the properties we want. The STOCKHISTORY function supports six properties that are specified by number . In this case, we want all properties (Date, Close, Open, High, Low, and Volume), so we list out all 6 numbers in the order that we want them:
STOCKHISTORY(I5,TODAY()-I8,TODAY(),,,0,1,2,3,4,5)
This completes the configuration for STOCKHISTORY. When entered, the result will be an array that will spill into multiple cells. By default, STOCKHISTORY will return information in chronological order with older dates appearing first. Note that the number of rows returned will vary according to the number in cell I8, and the number of days the market is not open in the date range provided; STOCKHISTORY will simply omit dates on which the market is not open. The output also depends on the time of day. If the market is already closed, STOCKHISTORY will return information for the current date.
Sorting results
In the example shown, we want to sort results in reverse chronological order. To do this we can nest the STOCKHISTORY function inside the SORT function like this:
=SORT(STOCKHISTORY(I5,TODAY()-I8,TODAY(),,,0,1,2,3,4,5),1,-1)
Inside SORT, the array returned by STOCKHISTORY becomes the array argument. Sort_index is provided as 1 since dates are in the first column, and sort_order is given as -1, since we want to sort dates in descending order.
The output of this formula is fully dynamic. If the symbol in cell I5 is changed, or the number for n in cell I8 is changed, the formula returns a new set of results.
