Grouping data with pivot tables
One of the most powerful features of pivot tables is their ability to group data. Any field added as a row or column label is automatically grouped by the values that appear in that field. For example, you might use a pivot table to group a list of employees by department. In this case, with the department field added as a row label, the pivot table neatly breaks out a count of employees by department, with a new row for each department that appears in the source data.

Voting results source data
Many people stop with this basic automatic grouping, but pivot tables can also group data in more sophisticated ways. For example, you can also use a pivot table to group data by numbers – summarizing data by age range, price range, or any numerical range that makes sense for your data. To illustrate, let’s assume you have a list of voting results that includes voter age, and you want to summarize the results by age group. Your data might look something like this:

The basic pivot table
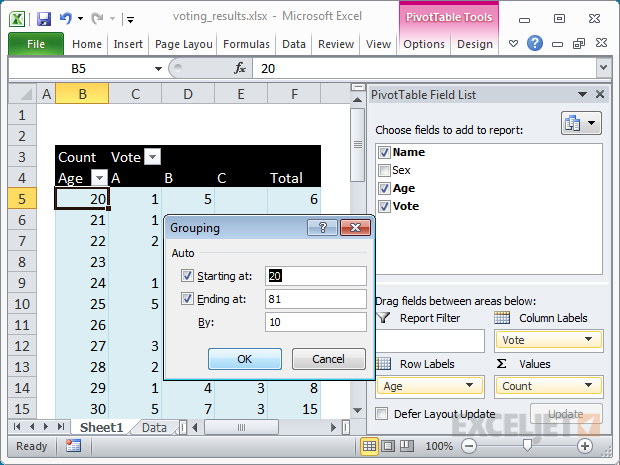
To get started grouping the data by age, first create your pivot table normally. Next, add the field Age as a Row Label, and the field Vote as a Column Label. Finally, add Name as a Value. In the example below, we also renamed Grand Total to Total. At this point, our pivot table looks like this:

Grouping by age
Although this pivot table is interesting, it’s not very useful, since the automatic grouping by actual age is too granular. We don’t care that five 20-year-olds voted for Option B – we want to see voting results by age ranges, like 20-29, 30-39, etc. This is easily done using the grouping feature built in to pivot tables. To group results by age, right-click any value in the Age field and choose Group from the menu.

Specifying the interval
When the Grouping dialog box appears, enter any interval that makes sense in the “By:” input area. For this example, we’ll group by 10 years.
The final result
When you click OK, you’ll see your data neatly grouped by age at 10 year intervals.

You can use this same approach to group numeric data in many useful ways. You can group customers by total sales, group employees by their time at a company, group weather data by temperature – the list is endless.
Learning pivot tables
Pivot tables are easy to create but hard to control. Our short video course, Core Pivot , walks you step-by-step through the most important features of Pivot Tables.
This article describes one way to model Adwords profitability in Excel. If you want to try out the spreadsheet, it’s attached below.
The most satisfying and powerful thing you can do with Excel is to model a real-world problem in a way that helps you make a better decision. For a model to be effective, it needs to expose inputs in a way that makes sense, and generate results that are easy to interpret.
In this article, we’ll use the seldom-seen Data Table to build a simple model that helps you visualize the profitability of a Google Adwords campaign.
Just like those word problems from your school days, the key is setting up the problem correctly.
A quick Adwords primer
Adwords is Google’s primary advertising service. For the purpose of this article, we’ll be discussing only Pay-per-click (PPC) advertising on Google’s search network.
When people search for things on Google, they use certain keywords. For example, they might search for “best todo list manager” or “japanese survival knife”. With Adwords, advertisers can bid on specific keywords. If the bid is high enough, the ads are displayed on the search result page, along with the search results. If a user clicks on an ad, the advertiser pays Google the amount of the bid. If a user doesn’t click on the ad, the advertiser pays nothing.
Making money with Adwords
In order to make money by advertising with Adwords, an advertiser must “convert” enough users into customers to pay for the clicks that don’t result in a sale, and still make a profit.
For example, if you, the advertiser, have a product that costs $100, and you bid on a keyword that costs $1.00 per click, you need to make a sale at least every 100 clicks just to break even:
100 clicks @ $1.00 = $100 = 1 sale
If you’re able to get more than one sale every 100 clicks, you’ll make money. If you get less than one sale per 100 clicks, you’ll lose money. If you have to pay $2.00 per click, you’ll need to make a sale at least every 50 clicks.
As you can see, if you’re going to use Adwords PPC to advertise, it’s important to understand the break-even point - that is, the conditions under which you’ll start to make money.
Note: To keep this article to the point, I am skipping a lot of potential complexity that could be part of Adwords. For example, you would normally bid on more than one keyword at the same time, the actual cost per click varies due to competition, etc.
Modeling the problem
Based on the information above, there are 3 key drivers of profit:
(1) the price of the product (2) the average cost per click (3) the percentage of clicks that can be converted to a sale
We can think of these as inputs (variables) for our problem. Intuitively, we know that a lower cost per click will allow us to buy more clicks per sale, and a higher conversion rate means we’ll need to buy fewer clicks to get each sale.
But what’s the best way to model the problem in Excel, so that we can see how the cost per click and conversion rate work together to determine profit? As usual, there is more than one way to skin the cat with Excel. However, the modest Data Table turns out to be a pretty good way to visualize the problem.
Setting things up
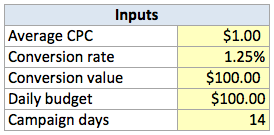
First things first, we need to provide an area on the worksheet meant for inputs. I like to group inputs together and label them in one area of the worksheet. For this problem, we’ll have:
- Average CPC - the average Cost Per Click
- Conversion rate - the percentage of clicks that can be converted into a sale
- Conversion value - the price of the product, less other costs (i.e. shipping)
- Daily budget - this determines how many clicks you can buy each day
- Campaign days - the number of days the campaign will run
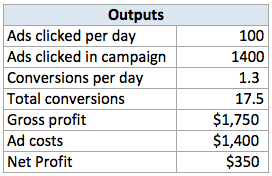
Now, we need to add an Outputs area. This is an area on the worksheet where will run the main calculations with fixed inputs. Specifically, we’ll figure out:
- Ads clicked per day = daily_budget / average_cpc
- Ads clicked in campaign = campaign_days * clicks_per_day
- Conversions per day = clicks_per_day * conversion_rate
- Total conversions = campaign_days * conversions_per_day
- Gross profit = total_conversions * value_per_conversion
- Ad costs = clicks_per_campaign * average_cpc
- Net Profit = gross_profit - total_ad_costs
With these formulas in place, we can actually figure out the break-even point manually, by fiddling around with the average cost per click and our estimated conversion rate.
But we don’t want to do that manually. We want Excel to do the hard work for us!
Enter the Data Table.
The Data Table
A Data Table is a dynamic table that shows the results of various input cells. Data Tables can handle either 1 or 2 inputs. In our case, a 2-input Data Table is a good fit, since we can cost per click as one input, and conversion rate as the other.
To create the data table:
- Add a reference to Net Profit to the upper left cell of the table
- Enter Average CPC estimates in the left column of the table
- Enter Conversion rate estimates in the top row of the table
- Select the entire table area
- Choose Data > Data Tools > What-If Analysis > Data Table
- In the Data table dialog box, select Conversion Rate for the Row Input
- In the Data table dialog box, select Average CPC for the Column Input
- Click OK.

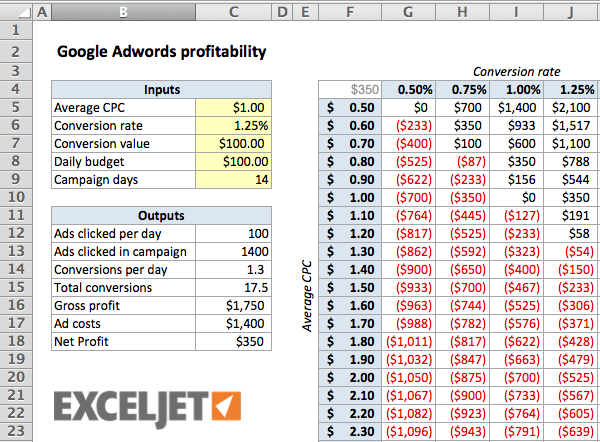
When you click OK, Excel will fill the table with Net Profit values that correspond to each pair of Average CPC and Conversion rate values. By using a currency number format with negative values displayed in red, you can easily see at a glance which combinations are profitable. Better yet, you can continue to adjust any of the main inputs, and all values plotted in the table will be updated dynamically.
Conclusion
Data Tables take a bit of work to set up, and they are limited to 2 inputs only, but they are a nice way to model a problem in a simple visual format.
Credits: This model was inspired by an example in John Walkenbach’s excellent book, Excel 2010 Bible .
