Purpose
Return value
Syntax
=IMSUM(inumber1,[inumber2],...)
- inumber1 - Complex number 1.
- inumber2 - [optional] Complex number 2.
Using the IMSUM function
The Excel IMSUM function returns the sum of two or more complex numbers. For example:
=IMSUM("4+3i","2-5i") // returns "6-2i"
Excel handles complex numbers as strings formatted like “x+yi” or “x+yj”. Use the COMPLEX function to get the string representing a complex number.
Examples
The IMSUM function takes in two or more arguments in the form inumber1 , inumber2 , inumber3, and so on. Arguments can be hard-coded values, cell references, or a range. Use the IMSUM function in a range like this:
=IMSUM(B6:B10) // sum complex numbers in B6:B10
If Excel encounters values not recognized as complex numbers, a #NUM! Error is thrown.
=IMSUM("4+3i", "invalid input") // throws #NUM! error
Explanation
The sum of two complex numbers is visualized by arranging the arrows tip-to-tail and drawing an arrow from the origin to the tip of the second number. For example, the sum of “4+3i” and “2-5i” is visualized below, where the arrow “6-2i” is the sum of the complex numbers.
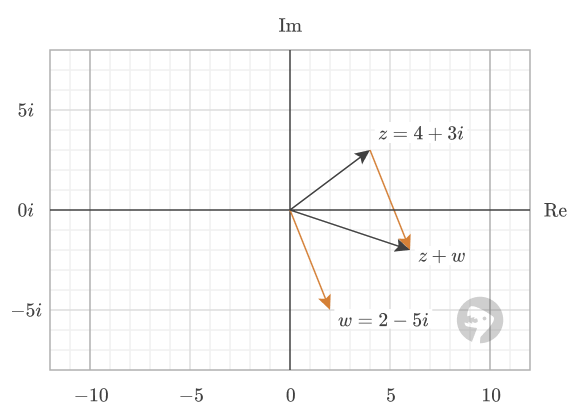
Image courtesy of wumbo.net .
Purpose
Return value
Syntax
=IMTAN(complex_num)
- complex_num - The complex number in the form “x+yi”.
Using the IMTAN function
The Excel IMTAN function returns the tangent of a complex number. For example, given the complex number “3+4i” as input, the function returns “-0.000187346+0.999355987i”
=IMTAN("3+4i") // returns -0.000187346+0.999355987i
Explanation
In math, the tangent of a complex number is defined in terms of complex sine and cosine functions.

In Excel, the tangent of a complex number is equivalent to the following formula.
=IMDIV(IMSIN(z),IMCOS(z)) // equivalent to IMTAN(z)
The 3D plot below visualizes the function’s real output. The horizontal XY plane represents input from the complex plane, and the vertical axis represents the function’s real output.

The output along the real axis forms the shape of the regular (circular) tangent function .

The imaginary output of the function is visualized by the 3D plot below.

The output along the imaginary axis forms the shape of the hyperbolic tangent function .

