Purpose
Return value
Syntax
=PERCENTRANK(array,x,[significance])
- array - Array of data values.
- x - Value to rank.
- significance - [optional] Number of significant digits in result. Defaults to 3.
Using the PERCENTRANK function
The PERCENTRANK function returns the relative standing of a value within a data set as a percentage. For example, a test score greater than 80% of all test scores is said to be at the 80th percentile. In this case, PERCENTRANK will assign a rank of .80 to the score. To use PERCENTRANK, provide an array of values (typically a range) and the value to rank, x . In the example shown, the formula in C5 is:
=PERCENTRANK(data,B5)
where data is the named range B5:B12. As the formula is copied down, it returns the rank of each value in column B as a decimal value. To display the results in column C as a percentage, apply the percentage number format . The table in the range F4:G15 is for reference only. It uses the PERCENTILE function in column G to calculate a percentile for each value in column F. A percentile is the value below which a given percentage of observations in a group fall.
The named range data is used for convenience only, since named ranges automatically behave like absolute references . If you prefer, you can use an absolute reference like $B$5:$B$12 instead of a named range.
Note: Microsoft classifies PERCENTRANK as a " compatibility function “, now replaced by the PERCENTRANK.INC function.
Inclusive vs. Exclusive
Starting with Excel 2010, the PERCENTRANK function has been replaced by two functions: PERCENTRANK.INC and PERCENTRANK.EXC . The INC version represents “inclusive” behavior, and the EXC version represents “exclusive” behavior. Both formulas use the same arguments.
- Use the PERCENTRANK.EXC function to determine the percentage rank exclusive of the first and last values in the array.
- Use the PERCENTRANK.INC or PERCENTRANK to find the percentage rank inclusive of the first and last values in the array.
Notes
- If x does not exist in the array, PERCENTRANK interpolates to find the percentage rank.
- When significance is omitted PERCENTRANK returns three significant digits (0.xxx)
Purpose
Return value
Syntax
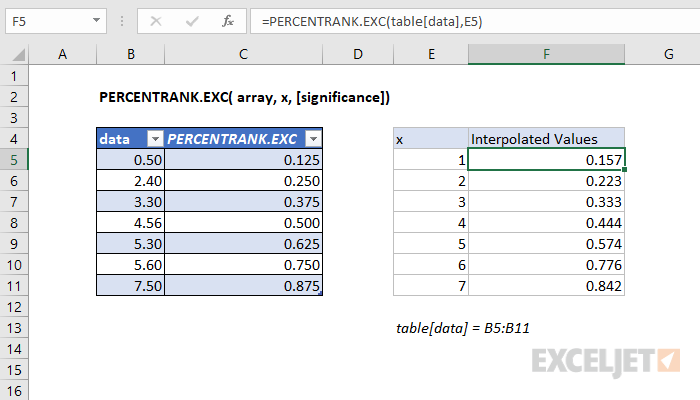
=PERCENTRANK.EXC(array,x,[significance])
- array - Array of data values.
- x - Value to rank.
- significance - [optional] Number of significant digits in result. Defaults to 3.
Using the PERCENTRANK.EXC function
The Excel PERCENTRANK.INC returns the relative standing of a value within a data set as a percentage. For example, a test score greater than or equal to 80% of all test scores is said to be at the 80th percentile. In the example shown, the formula in C5 is:
=PERCENTRANK.EXC(data,B5)
where “data” is the named range C5:C12.
Interpolation
When x does not exist within the array, the function interpolates a value between data points. For example, when the x value of 4.00 is passed as an argument to the function, the percentage is interpolated to 44.4%, which lies between the percent ranks of 3.3 and 4.56, which are 37.5% and 50.0%, respectively.
In the graph below, solid orange dots represent x values that are contained within the input array, while the outlined orange dots are values that are interpolated.

Inclusive vs. Exclusive
Starting with Excel 2010, the PERCENTRANK function has been replaced by two distinct functions: PERCENTRANK.INC and PERCENTRANK.EXC . Both functions use the same arguments, but they differ in how they handle the boundaries of the dataset:
- PERCENTRANK.INC (Inclusive): Calculates the percentage rank of a value within the full range of the dataset, including the first and last values. The output is within the range [0,1], inclusive of the endpoints.
- PERCENTRANK.EXC (Exclusive): Calculates the percentage rank in a slightly different way by conceptually adding two virtual values—one smaller than the smallest actual value and one larger than the largest actual value. As a result, the percentage rank of the smallest value will be slightly above 0, and the rank of the largest value will be slightly below 1. The output falls within the range (0,1), exclusive of the endpoints.
The screen below shows differences with a small data set:


As the size of the input array increases, the difference between the two functions decreases. The difference between the returned percentages will never be larger than 1/(N+1), where N is the size of the input array.
Notes
- If x does not exist in the array, PERCENTRANK.EXC interpolates to find the percentage rank.
- When significance is omitted, PERCENTRANK.EXC returns three significant digits (0.xxx)
