Purpose
Return value
Syntax
=PHI(x)
- x - The value (z-score) for which you want the density of the standard normal distribution.
Using the PHI function
The PHI function calculates the value of the probability density function for a standard normal distribution at a given point. The standard normal distribution is a normal distribution with a mean of 0 and a standard deviation of 1. The PHI function is often used in statistical analysis, data science, and financial modeling to understand how likely a value is within a standard normal distribution.
For example, the following formula returns the value of the standard normal density function at 1:
=PHI(1) // returns 0.241970725
Key features
- Returns the relative likelihood of a value in the standard normal distribution
- Useful for statistical analysis, anomaly detection, and model building
- Works only with standard normal distributions (mean = 0, standard deviation = 1)
Note: PHI returns the value of the density function, not the cumulative probability. PHI is equivalent to NORM.S.DIST with the cumulative flag set to FALSE. To get the cumulative probability, use NORM.S.DIST with the cumulative flag set to TRUE.
- Key features
- Example #1 - Basic usage
- Example #2 - Using z-scores
- Example #3 - Error handling
- When to use
- Related functions
Example #1 - Basic usage
The PHI function takes a single argument, x , and returns the value of the standard normal density function at that point:
=PHI(-2) // returns 0.053990967
=PHI(-1) // returns 0.241970725
=PHI(0)  // returns 0.398942280
=PHI(1)  // returns 0.241970725
=PHI(2)  // returns 0.053990967
Example #2 - Using z-scores
The PHI function can be used to calculate PDF values for normal distributions with different means and standard deviations. For example, suppose you have a list of values from a normal distribution with a mean of 83 and a standard deviation of 5. To find the probability density for each value, you first calculate the z-score, then use the PHI function.
=PHI(STANDARDIZE(93,83,5)) // returns 0.0539909665
The z-score of a value, which measures how many standard deviations a value is from the mean, can be calculated using the STANDARDIZE function:
=STANDARDIZE(93,83,5) // returns 2
or manually like this:
z = (value - mean) / stdev
The following table shows the density for each value in the normal distribution with a mean of 83 and a standard deviation of 5:
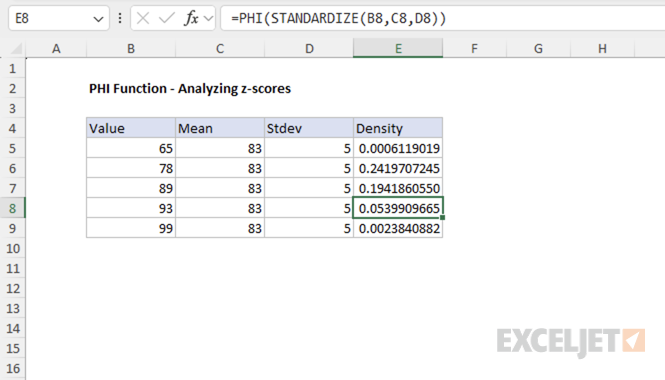
This approach allows you to use PHI to calculate the PDF for any normal distribution, not just the standard normal.
Example #3 - Error handling
The PHI function returns the #VALUE! error if x is not numeric.
=PHI("apple") // returns #VALUE!
When to use
Use the PHI function when you need the value of the standard normal density function (mean = 0, standard deviation = 1) at a specific point. PHI is equivalent to NORM.S.DIST(x, FALSE) . For cumulative probability, use NORM.S.DIST(x, TRUE) .
If you need the density for a normal distribution with a different mean or standard deviation, first convert your value to a z-score (see Example #2), or use the NORM.DIST function.
Related functions
Excel provides several related functions for working with normal distributions:
- NORM.S.DIST - Returns the cumulative distribution or density for the standard normal distribution.
- NORM.DIST - Returns the cumulative distribution or density for a normal distribution with specified mean and standard deviation.
- NORM.INV - Returns the inverse of the normal cumulative distribution.
- STANDARDIZE - Converts a value to a z-score.
Purpose
Return value
Syntax
=PROB(x_range,prob_range,lower_limit,[upper_limit])
- x_range - A range of numeric values representing the possible outcomes.
- prob_range - A range of probabilities corresponding to the values in x_range (must sum to 1).
- lower_limit - The lower bound for the probability calculation.
- upper_limit - [optional] The upper bound for the probability calculation. If omitted, PROB returns the probability that x equals lower_limit.
Using the PROB function
The PROB function calculates probabilities for discrete probability distributions by summing the probabilities of all values in the x_range that fall within the specified limits. When upper_limit is omitted, PROB returns probability of the lower_limit value. This function is useful for analyzing discrete data where you have known outcomes and their associated probabilities.
Key features
Works with discrete probability distributions
Requires probabilities in prob_range to sum to 1
Can calculate probability for a single value or a range of values
When upper_limit is omitted, returns probability of the lower_limit value
Returns #NUM! error if probabilities don’t sum to 1
Key features
Example #1 - Single value probability
Example #2 - Range probability
Example #3 - Error conditions
When to use PROB
Example #1 - Single value probability
In this example, we have a dataset showing quiz scores and their corresponding probabilities. To find the probability of getting exactly a score of 7, we pass in 7 for the value of lower_limit .

=PROB(B5:B15, C5:C15, E5)
This formula returns 0.20, meaning there is a 20% chance of getting exactly a score of 7.
The function works by: 1. Finding the value 7 in the x_range (B5:B15) 2. Returning the corresponding probability from prob_range (C5:C15) 3. Since 7 appears in the table, it returns the probability of 0.20
Example #2 - Range probability
To find the probability of getting a score between 5 and 8 (inclusive), we use both the lower_limit and upper_limit arguments:
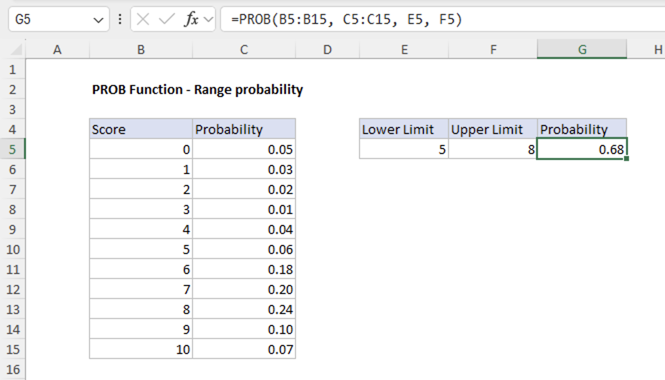
=PROB(B5:B15, C5:C15, E5, F5)
This formula returns 0.68, meaning there is a 68% chance of getting a score between 5 and 8 inclusive.
The function works by: 1. Finding all values in x_range that are >= 5 and <= 8 2. Summing the corresponding probabilities from prob_range 3. For scores 5, 6, 7, and 8: the probabilities sum to 0.68
Example #3 - Error conditions
The PROB function returns the following errors:
If the probabilities in prob_range don’t sum to 1, the function returns #NUM! error
=PROB({1,2,3},{0.2,0.3,0.4},2) // returns #NUM!
If x_range and prob_range have different numbers of values, the function returns #N/A error
=PROB({1,2,3},{0.2,0.3},2) // returns #N/A
If any argument is non-numeric or contains non-numeric values (e.g., text), the function returns #NUM! error
=PROB({"1",2,3},{0.2,0.3,0.5},2) // returns #NUM!
When to use PROB
The PROB function is ideal for analyzing discrete probability distributions like calculating probabilities for survey results. These are scenarios where you have a complete set of possible outcomes and their associated probabilities. For continuous probability distributions, Excel provides distribution functions like NORM.DIST , EXPON.DIST , or WEIBULL.DIST .
