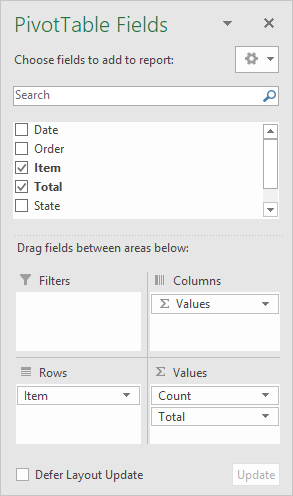
A Pivot Table is a special tool in Excel for summarizing data without formulas. The Pivot Table interface behaves like a report generator, allowing you to interactively add and remove fields as you like. The screen below shows the how fields have been configured to build the pivot table shown above.
When data changes, you can simply refresh the pivot table to see a new summary. Pivot tables automatically group data using field values.
For more details and examples, see Excel Pivot Tables .
Power Query is a tool in Excel that allows you to import data from a wide variety of sources, and manipulate that data to meet your needs. For example, you can:
- Import a CSV file on your computer
- Import a table from a web page
- Import data from an online database
In addition to importing data to Excel, Power Query is designed to “transform” data. You can easily do things like remove columns or rows, rename and reorder columns, split columns, add new columns, fix date problems, join tables, and much more.
The beauty of Power Query is that each step is defined separately in a query. When you “refresh” the data, all steps will be automatically repeated in exactly the same order.
You can find Power Query tools on the Data tab of the ribbon:

Key benefits
Power Query has a vast set of features that are updated frequently. In a nutshell, here are a few key benefits:
- Import data of all kinds directly into Excel with a modern and robust tool.
- Refresh data directly in the Excel workbook. No need to navigate back to a website and download data manually.
- Define specific steps to retrieve, clean, and reshape data. These steps will be repeated, in order, each time data is refreshed.
- Drop data into an Excel Table to analyze with formulas, pivot tables, and charts.
Power Query Examples
These articles have sample workbooks with simple queries already set up:
- Tracking COVID-19 with Excel (more detail)
- Download Coronavirus data to Excel (3 more datasets)
