Pivot tables can group dates by year, month, and quarter. This comes in handy if you want to count birthdays that occur in each month, while ignoring the year. In the example shown, there are 100 names and birthdays in the source data. A pivot table is used to count the birthdays that occur in each month of the year.
Fields
The source data contains two fields: Name , and Birthdate . Both fields are used to create the pivot table:

The Birthdate field has been added as a Row field and grouped by Months only:

The Name field has been added as a Value field. Because Name is a text field, the field is summarized by count automatically:

Helper column alternative
As an alternative to automatic date grouping, you can add a helper column to the source data, and use a formula to extract the month . Then add the Month field to the pivot table directly.
Formula alternative
As an alternative to a pivot table, you can use the SUMPRODUCT function to count by month, as seen in this example .
Steps
- Create a pivot table
- Add Birthdate field to Rows area Group by Months only
- Add Name field to Values area
Notes
- Any non-empty field in the data can be used in the Values area to get a count.
- When a text field is added as a Value field, Excel will display a count automatically.
A pivot table is an easy way to count blank values in a data set. In the example shown, the source data is a list of 50 employees, and some employees are not assigned to a department. The Pivot Table is configured to group out data by department, and automatically creates a category called “(blank)” for employees without a department value.
Fields
The pivot table shown is based on three fields: First, Last, and Department. The Department field is configured as a Row field, and Last is configured as a Value field, renamed “Count”.
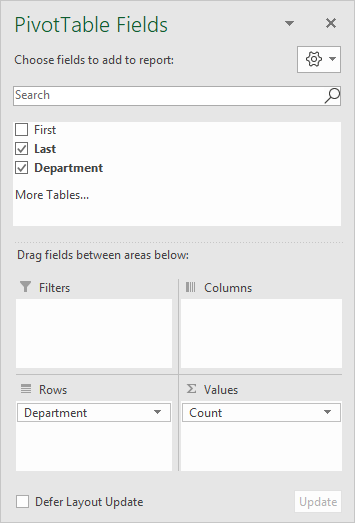
The Last field is renamed “Count” and configured to summarize by count:
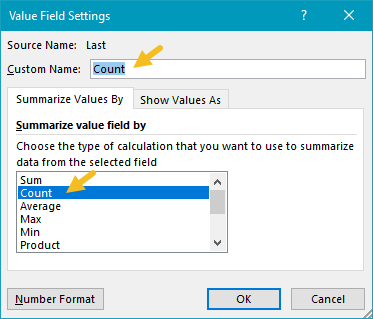
In the example shown, the pivot table uses the Last field to generate a count. Any text field in the data that is guaranteed to have data can be used to calculate count.
Steps
- Create a pivot table
- Add Department field to the rows area
- Add Last field Values area
Notes
- Any non-blank field in the data can be used in the Values area to get a count.
- When a text field is added as a Value field, Excel will display a count automatically.
