A pivot table is a handy tool for estimating projects. As long as the data is well structured, a pivot table can easily handle hundreds or even thousands of line items. You can group these items by category, by phase, by contractor, and so on. Once the pivot table is created, you can easily adjust filters to show only parts of the project as needed. In the example shown, the source data is extremely basic, and a pivot table is used to group by area and display a sum plus a percentage of the total.
Fields
The source data in the example contains three fields: Area , Item , and Cost . The pivot table as shown uses only two of these fields: Area and Cost .
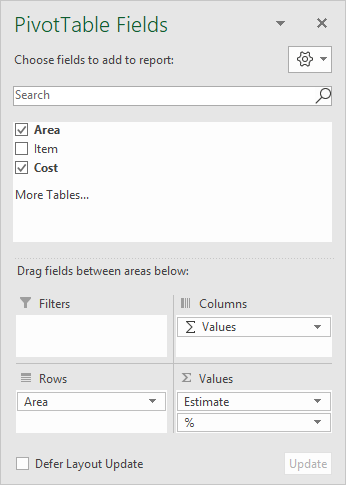
Area is a Row field, and Cost has been added twice as a Value field, once to show the total cost, and once to show a percentage breakdown. To show the total estimated cost, the Cost field is set to sum values and has been renamed “Estimate”:
<img loading=“lazy” src=“https://exceljet.net/sites/default/files/images/pivot/inline/pivot%20table%20project%20estimate%20cost%20value%20settings.png" onerror=“this.onerror=null;this.src=‘https://blogger.googleusercontent.com/img/a/AVvXsEhe7F7TRXHtjiKvHb5vS7DmnxvpHiDyoYyYvm1nHB3Qp2_w3BnM6A2eq4v7FYxCC9bfZt3a9vIMtAYEKUiaDQbHMg-ViyGmRIj39MLp0bGFfgfYw1Dc9q_H-T0wiTm3l0Uq42dETrN9eC8aGJ9_IORZsxST1AcLR7np1koOfcc7tnHa4S8Mwz_xD9d0=s16000';" alt=“Cost value settings, renamed “Estimate” - 2”>
To show a percentage breakdown, the Cost field is added again to the Value area and renamed “%”. Show Values As is set to a percentage of grand total:
<img loading=“lazy” src=“https://exceljet.net/sites/default/files/images/pivot/inline/pivot%20table%20project%20estimate%20percent%20value%20settings.png" onerror=“this.onerror=null;this.src=‘https://blogger.googleusercontent.com/img/a/AVvXsEhe7F7TRXHtjiKvHb5vS7DmnxvpHiDyoYyYvm1nHB3Qp2_w3BnM6A2eq4v7FYxCC9bfZt3a9vIMtAYEKUiaDQbHMg-ViyGmRIj39MLp0bGFfgfYw1Dc9q_H-T0wiTm3l0Uq42dETrN9eC8aGJ9_IORZsxST1AcLR7np1koOfcc7tnHa4S8Mwz_xD9d0=s16000';" alt=“Cost value settings for percentage, renamed “%” - 3”>
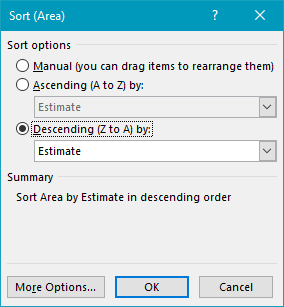
Finally, the Area field is sorted in descending order by Estimate (Cost):
Steps to create this pivot table
- Create a pivot table
- Add Area as a Row field
- Add Cost as a Value field Rename to “Estimate” Summarize by Sum Set number formatting to currency
- Add Cost as a Value field Rename to “%” Summarize by Sum Display Percent of Grand Total Set number formatting to percentage
- Sort Area by Estimate
Pivot tables provide a built-in ranking feature, and can rank smallest to largest or largest to smallest. In the example shown, a pivot table is used to group and rank sales by item. The pivot table is also sorted by rank so that the top sales items appear first.
Fields
The source data contains six fields, but only two fields are used to build the pivot table, Item and Amount:

Item has been added as a Row field. The Amount field has been added twice as a value field. The first instance of Amount has been renamed “Sales” and set to sum values:

The second instance of Amount has been renamed “Rank”. The rank value is created by setting “Show values as” to “Rank largest to smallest”, with Item set as the Base field:

Items are sorted by Rank in Descending order:

Steps
- Create a pivot table , and tick “Add data to data model”
- Add Item field to the rows area
- Add Amount as a Value field, and rename to “Sales”
- Add Amount as a Value field, and rename to “Rank”
- Set Rank to “largest to smallest with Item as the base field
- Sort the pivot table by Item in descending order
