Pivot tables are an easy way to quickly sum unique values in a data set, and can easily be adapted to perform a two-way sum. In the example shown above, a pivot table is used to sum The Qty field for unique combinations of City and Size, based on data in the range B5:D17, defined as an Excel Table .
Fields
The pivot table shown is based on three fields: City, Size, and Qty. The City field is added as a Row field, and the Size field is added as a Column field. The Qty field is added as a Value field:
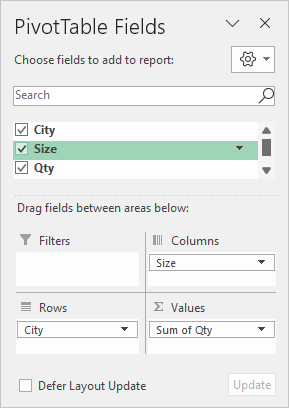
The Qty field in the Values area is configured to Sum:
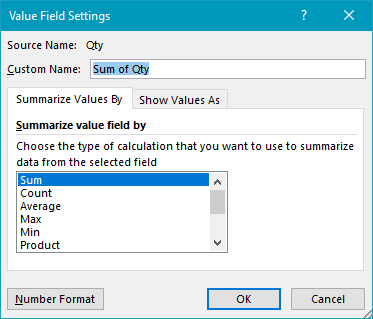
By default, the Pivot Table automatically sums values in the Qty field, so there is no need to change the calculation in this case.
Steps
- Define data as an Excel Table (optional)
- Create a pivot table based on a table (or data)
- Add the City field to the Rows area
- Add the Size field to the Columns area
- Add the Qty field to the Values area
Notes
- When a numeric field is added as a Value field, Excel the field is automatically summed.
By default, a Pivot Table will count all records in a data set. To show a unique or distinct count in a pivot table, you must add data to the object model when the pivot table is created. In the example shown, the pivot table displays how many unique colors are sold in each state.
Fields
The pivot table shown is based on two fields: State and Color. The State field is configured as a row field, and the Color field is a value field, as seen below.
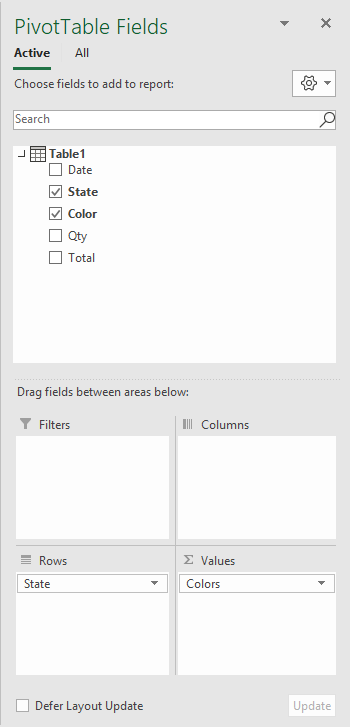
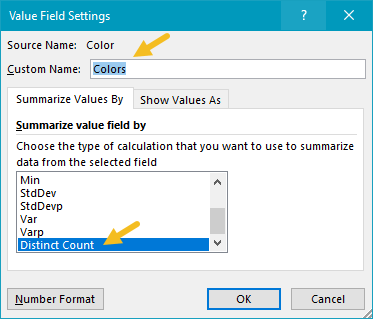
In the Pivot Table, the Color field has been renamed “Colors”, and “Summarize values by” has been set to “Distinct count”:
Data model
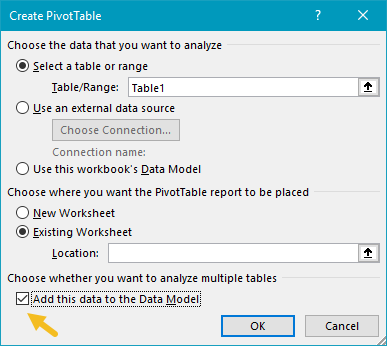
When the Pivot Table is created, the “Add this data to the Data Model” box is checked. This is what makes the distinct count option available.
Steps
- Create a pivot table , and tick “Add data to data model”
- Add State field to the rows area (optional)
- Add Color field to the Values area
- Set “Summarize values by” > “Distinct count”
- Rename Count field if desired
Notes
- Distinct count is available in Excel 2013 and later
