Bar charts are great for comparing things, because it’s easy to see how bar lengths differ. This chart is an example of a clustered bar chart showing product units sold this year versus last year. The data used for this chart looks like this on the worksheet:

How to make this chart
- Select the data and insert a bar char on the ribbon:
- Insert the first 2D bar chart option:
- Right-click each data series and use fill tool to change color:
- After changing colors:
- Select vertical axis, and reverse category order:
- Move legend to top:
- Final chart:
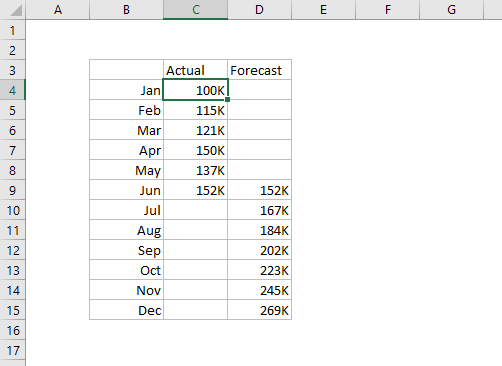
This chart shows actuals so far in a solid line with forecast numbers in a dashed line. The chart type is set to line chart, and actual and forecast values are plotted as two data series. The data used for the chart is set up as shown below:
How to make this chart
- Select the data and insert a line chart:
- Choose the first option, a basic line chart:
- Chart as inserted:
- Select Forecast data series and apply dashed line:
- After setting dashed line on Forecast data series:
From this point, you can set the chart title and move the legend.
