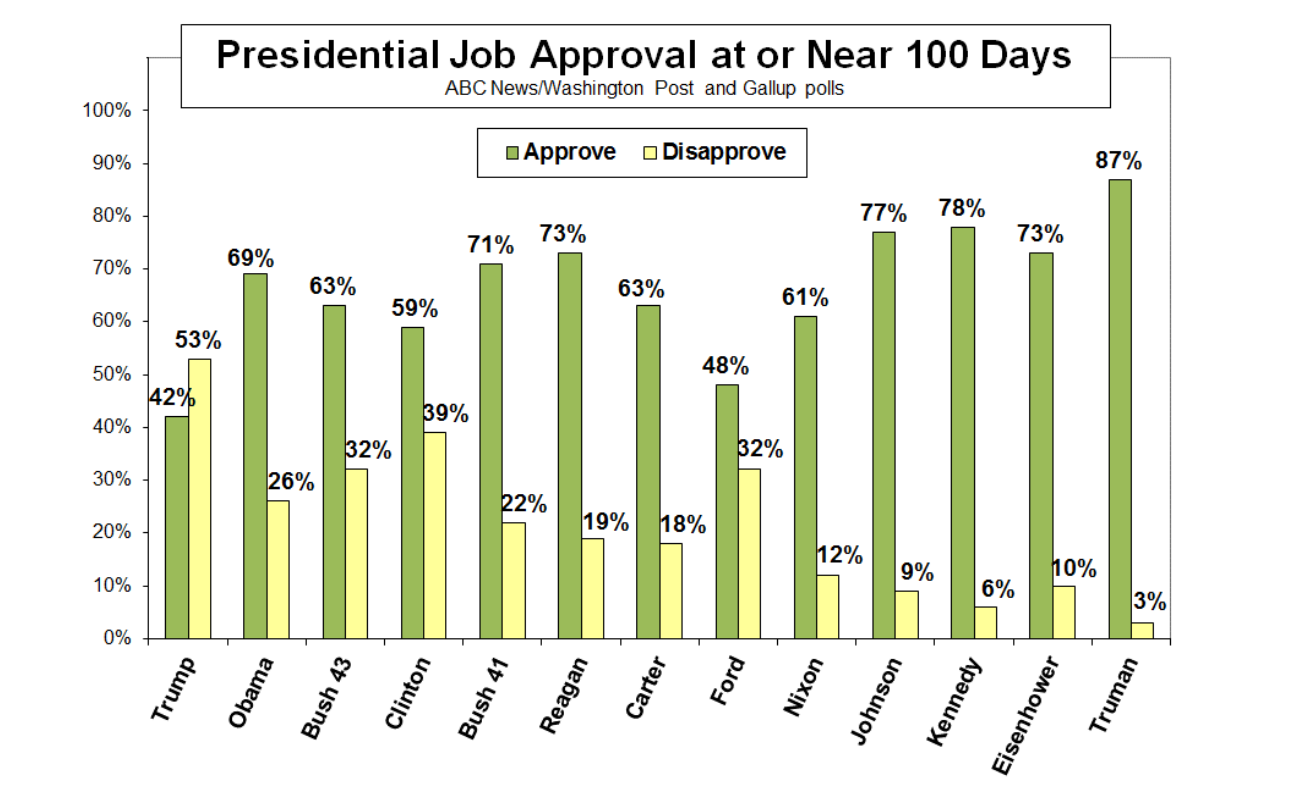
I first saw a link to this chart on Politico . The original chart is a clustered column chart, but I though it would be interesting to show the data in a stacked bar chart instead. Stacked bar charts make it a lot easier to compare bar lengths. Here’s the original:
One thing to note is the approval and disapproval ratings don’t add up to 100%. This is due to some survey respondents expressing no opinion. I played with plotting “no opinion” as a another data series in the chart, but decided to leave it out to keep things simple.
Update: The Washington Post now has a full page of fancy poll result charts.
Steps to create
- Add the data to a worksheet
- Select the data
- Insert > Recommended Charts > Stacked Bar Chart
- Delete vertical gridlines
- Move legend to top
- Add title and increase font size
- Add data labels
Data
| President | Approve | Disapprove |
|---|---|---|
| Trump | 42% | 53% |
| Obama | 69% | 26% |
| Bush 43 | 63% | 32% |
| Clinton | 59% | 39% |
| Bush 41 | 71% | 22% |
| Reagan | 73% | 19% |
| Carter | 63% | 18% |
| Ford | 48% | 32% |
| Nixon | 61% | 12% |
| Johnson | 77% | 9% |
| Kennedy | 78% | 6% |
| Eisenhower | 73% | 10% |
| Truman | 87% | 3% |
Sources: langerresearch.com , Washington Post-ABC Poll (Reagan-Trump), Gallup polls (Eisenhower-Carter) | wapo.st/pollarchive
