I first saw a reference to this data on the interesting News, in Data site. The data cited comes from the drugabuse.gov website , and is presented in a combo chart with columns showing overall heroin deaths and lines showing the male and female breakdown. As the site says, from 2002 to 2015 there was a 6.2-fold increase in the total number of deaths. Here’s one of the original charts:
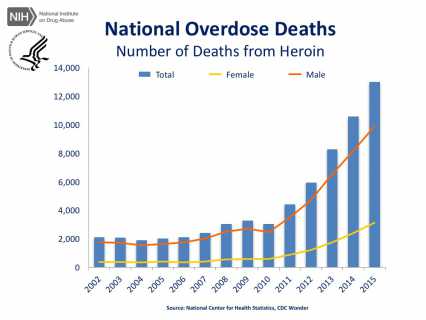
Since there are 14 columns in the chart, and the lines are somewhat hard to interpret, I though it would be interesting to plot the data in a stacked area chart. Stacked area charts aren’t so good at showing individual data points, but they work well to show overall trends. Also, unlike column charts, they can handle way many more data points without becoming cluttered. The example up top actually plots 3 more years of data, going back to 1999.
It would be interesting to show the average street price of heroin during this same period. If you have a source for that data, let me know in a comment below.
I first saw a link to this chart on Politico . The original chart is a clustered column chart, but I though it would be interesting to show the data in a stacked bar chart instead. Stacked bar charts make it a lot easier to compare bar lengths. Here’s the original:
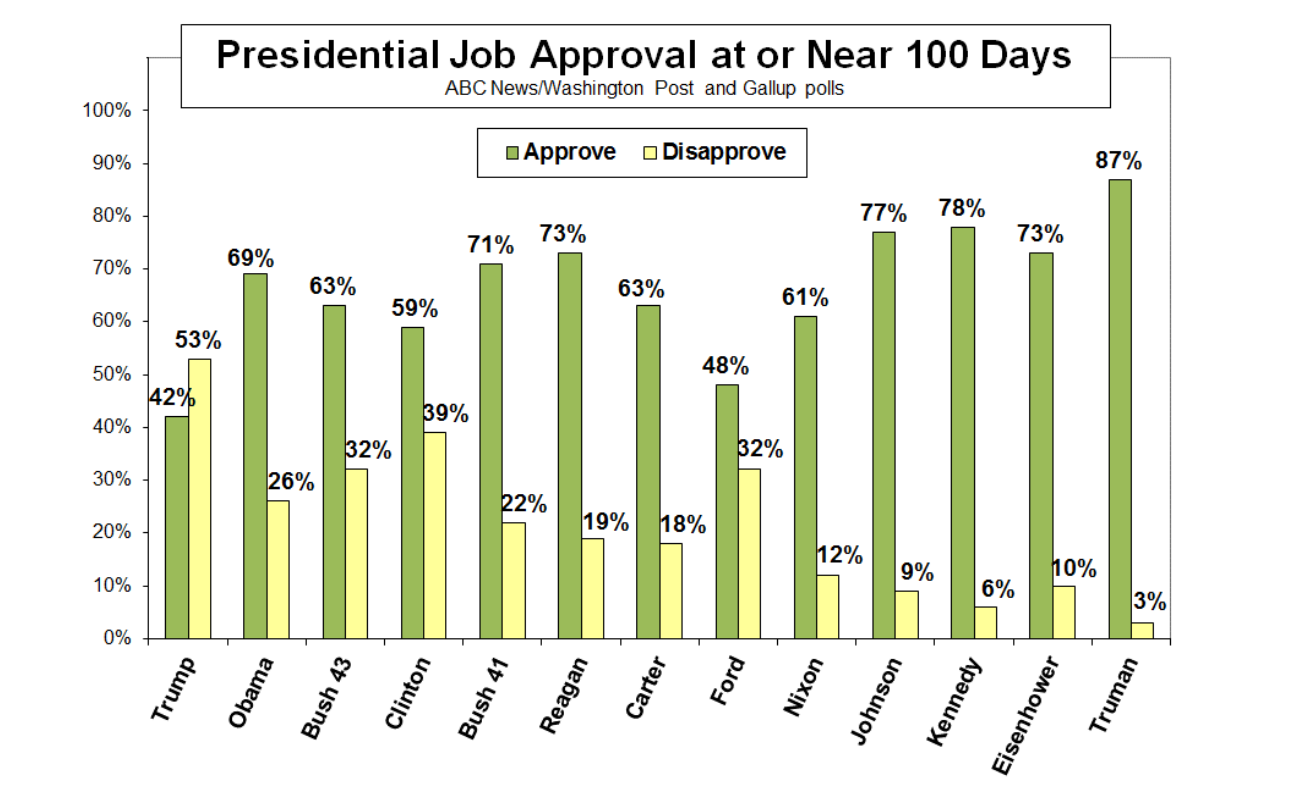
One thing to note is the approval and disapproval ratings don’t add up to 100%. This is due to some survey respondents expressing no opinion. I played with plotting “no opinion” as a another data series in the chart, but decided to leave it out to keep things simple.
Update: The Washington Post now has a full page of fancy poll result charts.
Steps to create
- Add the data to a worksheet
- Select the data
- Insert > Recommended Charts > Stacked Bar Chart
- Delete vertical gridlines
- Move legend to top
- Add title and increase font size
- Add data labels
Data
| President | Approve | Disapprove |
|---|---|---|
| Trump | 42% | 53% |
| Obama | 69% | 26% |
| Bush 43 | 63% | 32% |
| Clinton | 59% | 39% |
| Bush 41 | 71% | 22% |
| Reagan | 73% | 19% |
| Carter | 63% | 18% |
| Ford | 48% | 32% |
| Nixon | 61% | 12% |
| Johnson | 77% | 9% |
| Kennedy | 78% | 6% |
| Eisenhower | 73% | 10% |
| Truman | 87% | 3% |
Sources: langerresearch.com , Washington Post-ABC Poll (Reagan-Trump), Gallup polls (Eisenhower-Carter) | wapo.st/pollarchive
